How to make sense of Shock Dyno Graphs

Post your questions or tips about wheels, tires, alignment, or anything related to preparing an autocross or track car here.
Daniel Dejon
Notorious
Drives: 2006 Lancer Evolution
User avatar
Joined: November 2015
Posts: 1079
First Name: Daniel
Last Name: Dejon
Favorite Car: 2006 Lancer Evolution

How to make sense of Shock Dyno Graphs

Postby CaptainSquirts » Mon May 07, 2018 2:33 pm

So, anyone know of anywhere that has an easy explanation of how shock dyno graphs work? Everywhere I look it's pretty complicating and hard to grasp.
So far I get the understanding on the low speed bumps, more driver input related(dive, squats and what not) and high speed bumps(curbs, pot holes, bumps, stuff like that).

So using the shock dyno graph pictured below. I read that 2ish and lower inches represents the low speed and higher would be the mid/highspeed bumps. I don't fully understand it but I see it's stated :-D .

So I'm having a hard time understanding the graph/numbers themselves(pretty much everything). I get positive means compression and negative means rebound. But I don't fully get the numbers themselves. I guess the whole Velocity (inch/second) on the graph confuses me.

Image
Loren Williams
Forum Admin
Drives: A Mirage
User avatar
Location:
Safety Harbor
Joined: December 2006
Posts: 13047
First Name: Loren
Last Name: Williams
Favorite Car: A Mirage
Location: Safety Harbor

How to make sense of Shock Dyno Graphs

Postby Loren » Mon May 07, 2018 3:57 pm

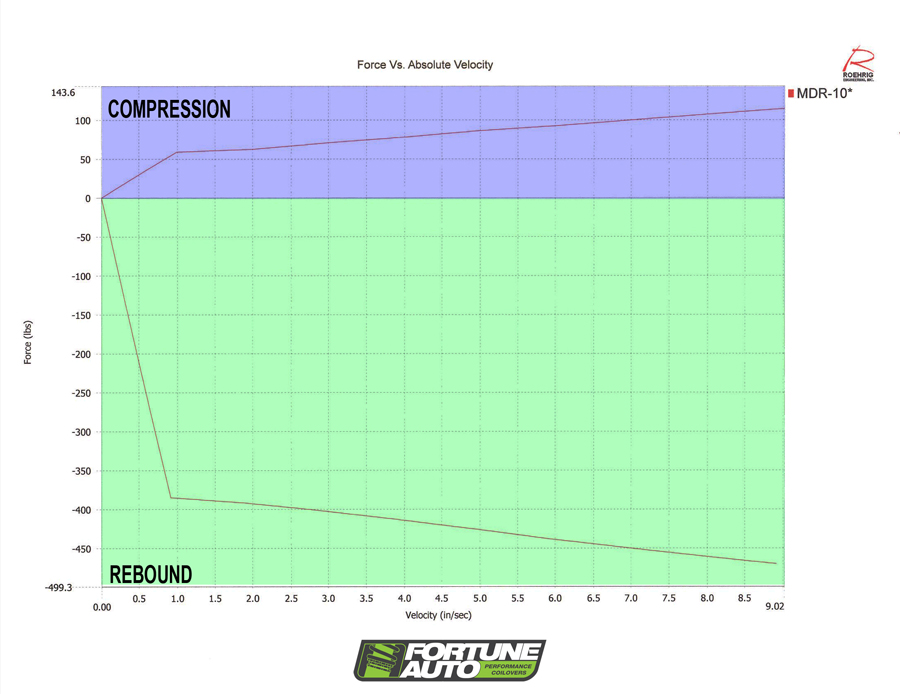
Velocity is shock shaft speed. Force is... force.

You've already noted that "low speed" is typically steering inputs (and to some extent, smaller bumps).

The graph is just showing you how much force it takes to move the shock at various shaft speeds. If you're moving it slowly, it takes less force. As you move it faster, it takes more force.

If the lines on the chart were straight lines. One straight line for compression, one straight line for rebound. That would be "linear" valving. I guess (maybe) you might find that in a race car. Or maybe before shocks got all fancy (whenever that happened) they could have been more simple devices with more linear response.

Now, street shocks (and as far as I know, most race shocks) have some degree of "digressive valving". What that means is that the shock responds in a linear fashion, gets stiffer as the shaft speed increases... but, does so at a pretty steep rate (this gives you crisp steering response). And then, as it reaches the "knee point", a secondary valve (or shim in the stack, or relief hole, or however they do it) opens up and lets to shock be "softer" for higher speed inputs.

That "knee point" is going to be somewhere just about the kind of shaft speeds you would typically see with steering inputs and "normal" bumps. The digressive valving is there to allow the suspension to suck up something like a speed bump, or a railroad crossing... or the curbing at turn 7 on Sebring. If the valving stayed linear, the car would "pogo" over a big bump like that.

How'd I do?

If you want to know more than that, you should talk to John Lambert. He's played with revalving Bilsteins and has a much better understanding of that kind of thing.
Loren Williams - Loren @ Invisiblesun.org
The "Push Harder, Suck Less" philosophy explained:
Push Harder - Drive as close to the limit of your tires as possible.
Suck Less - Drive something resembling a proper racing line.
---------- ----------
Notorious
Drives: Whatever has more miles than anything on the grid
User avatar
Location:
Just within reach of storm surge
Joined: December 2006
Posts: 2308
First Name: ----------
Last Name: ----------
Favorite Car: Whatever has more miles than anything on the grid
Location: Just within reach of storm surge

How to make sense of Shock Dyno Graphs

Postby Jamie » Mon May 07, 2018 9:51 pm

The rebound is also helping control your motion as the springs extend after a bump or coming out of a corner. Over a bump, you want the let the spring put the wheel back down fast, but if the car's rolling back to level, you want to slow the roll rate, hence the sharp increase in resistance as the spring unloads.
Jamie
'01 Miata, '92 Prelude Si, '88 Alpina B10/3.5, '63 Suburban
Speed Demon Racing
Daniel Dejon
Notorious
Drives: 2006 Lancer Evolution
User avatar
Joined: November 2015
Posts: 1079
First Name: Daniel
Last Name: Dejon
Favorite Car: 2006 Lancer Evolution

How to make sense of Shock Dyno Graphs

Postby CaptainSquirts » Tue May 08, 2018 8:56 am

So does the flow per screenshot go in this order for a low speed shaft movement.

1. Car is moving, no leaning or anything. I assume it won't be at 0 lbs since the shocks are always bumping/extending even on flat surfaces as you're driving.
2. I turn the vehicle and the car starts to lean. Goes from 0ish(give or take some lbs from small bumps and what not) to anything before it hits the knee in the compression.
3. As you straighten out the car, the body starts to go back to level which is in the rebound state until it gets to near 0.
shock.png
Loren Williams
Forum Admin
Drives: A Mirage
User avatar
Location:
Safety Harbor
Joined: December 2006
Posts: 13047
First Name: Loren
Last Name: Williams
Favorite Car: A Mirage
Location: Safety Harbor

How to make sense of Shock Dyno Graphs

Postby Loren » Tue May 08, 2018 10:39 am

That looks about right.
Loren Williams - Loren @ Invisiblesun.org
The "Push Harder, Suck Less" philosophy explained:
Push Harder - Drive as close to the limit of your tires as possible.
Suck Less - Drive something resembling a proper racing line.
Daniel Dejon
Notorious
Drives: 2006 Lancer Evolution
User avatar
Joined: November 2015
Posts: 1079
First Name: Daniel
Last Name: Dejon
Favorite Car: 2006 Lancer Evolution

How to make sense of Shock Dyno Graphs

Postby CaptainSquirts » Thu May 10, 2018 2:08 pm

So when cornering and the shock is in the positive lbs of force, what does the number mean itself to the shock? So if it has 100 pounds of force, what does that 100 pounds actually do to the shock/vehicle? Same question for rebound. Doesn't have to be a crazy in depth answer, just some pretty simple so I can put the pieces together in my head to make sense of it.
Loren Williams
Forum Admin
Drives: A Mirage
User avatar
Location:
Safety Harbor
Joined: December 2006
Posts: 13047
First Name: Loren
Last Name: Williams
Favorite Car: A Mirage
Location: Safety Harbor

How to make sense of Shock Dyno Graphs

Postby Loren » Thu May 10, 2018 2:51 pm

The graph is telling you that at that point on the curve (the shaft is moving at this speed), it takes 100 pounds of force to MOVE the shaft. If you're not transferring an additional 100 pounds of weight onto that corner, it's NOT moving. It takes 100 pounds of weight transfer to overcome the stiffness of the shock.

You kind of need to think of the shock in the spring/shock system. You've got 500# of static weight on the corner, and you've got a 250# spring. The spring is compresed 2" and under static load, the spring is supporting the weight of the car. The shock is just there. Zero force applied to the shock, zero shaft speed. As you drive and enter a turn, the outside shock will compress... the rate will depend on how quickly you turn the wheel, and the force at that point is how much weight is transferred onto that corner. So, if it's a .5G turn, maybe you've put another 250# onto the shock.

I'm no pro at reading shock graphs, but I wonder if you're reading that one backwards. Seems like you'd have higher loads under compression. Rebound loads would be less, I would think.

Getting over my head here, and I don't care enough to research it.
Loren Williams - Loren @ Invisiblesun.org
The "Push Harder, Suck Less" philosophy explained:
Push Harder - Drive as close to the limit of your tires as possible.
Suck Less - Drive something resembling a proper racing line.
---------- ----------
Notorious
Drives: Whatever has more miles than anything on the grid
User avatar
Location:
Just within reach of storm surge
Joined: December 2006
Posts: 2308
First Name: ----------
Last Name: ----------
Favorite Car: Whatever has more miles than anything on the grid
Location: Just within reach of storm surge

How to make sense of Shock Dyno Graphs

Postby Jamie » Thu May 10, 2018 10:37 pm

No, what he's pinned up matches what I've seen before. But don't think of the shock in terms of load -- think of it in terms of speed. The purpose of the shock is to dampen spring motion (which is why much of the world calls it a damper). So look at it in terms of resisting spring motion. If you compress the spring with 100 lbs, the shock keeps that rate of compression to 7 in/sec. But when the spring unloads (rebound), releasing that 100 lbs, the shock restricts the rate of spring expansion to 0.5 in/sec -- much slower, so the car doesn't flop back over. That's why rebound is generally more important in cornering behavior. (That also tells you Philip's shocks have little rebound....)
Jamie
'01 Miata, '92 Prelude Si, '88 Alpina B10/3.5, '63 Suburban
Speed Demon Racing
Loren Williams
Forum Admin
Drives: A Mirage
User avatar
Location:
Safety Harbor
Joined: December 2006
Posts: 13047
First Name: Loren
Last Name: Williams
Favorite Car: A Mirage
Location: Safety Harbor

How to make sense of Shock Dyno Graphs

Postby Loren » Thu May 10, 2018 10:46 pm

Philips shocks don't have much of anything besides shiny yellow paint.
Loren Williams - Loren @ Invisiblesun.org
The "Push Harder, Suck Less" philosophy explained:
Push Harder - Drive as close to the limit of your tires as possible.
Suck Less - Drive something resembling a proper racing line.
Randy Barrera
Well-Known
Drives: S2000
Location:
Tampa
Joined: August 2015
Posts: 205
First Name: Randy
Last Name: Barrera
Favorite Car: S2000
Location: Tampa

How to make sense of Shock Dyno Graphs

Postby Rpwolf » Sat May 12, 2018 12:33 am

The labels you out on the graph are not right.

The shocks are almost always in a constant state of motion. Having so many "velocity points" muddies up everything.

Think of it like this: The sharper a bump on the road, the faster the shaft velocity. The knee helps visualize a soft and sharp bump (aka body movements with lots of force like slaloms).

Just becareful. some graphs are upside down, rebound isn't always negative, and the unit of measurement can be different. These graphs are almost only useful when attempting to visualize shock dynamics between, let's just say, the front and rear shocks of your car or shocks of similar constructions.
Loren Williams
Forum Admin
Drives: A Mirage
User avatar
Location:
Safety Harbor
Joined: December 2006
Posts: 13047
First Name: Loren
Last Name: Williams
Favorite Car: A Mirage
Location: Safety Harbor

How to make sense of Shock Dyno Graphs

Postby Loren » Sat May 12, 2018 12:53 am

Rpwolf wrote:Just becareful. some graphs are upside down, rebound isn't always negative, and the unit of measurement can be different.
I've heard this before.
Loren Williams - Loren @ Invisiblesun.org
The "Push Harder, Suck Less" philosophy explained:
Push Harder - Drive as close to the limit of your tires as possible.
Suck Less - Drive something resembling a proper racing line.

Return to “Autocross/Track Setup”

Who is online

Users browsing this forum: No registered users and 11 guests